
Bought in Past Month Indicator Decoded
It's widely believed that the Bought in past Month (BPM) Indicator accurately reflects the number of your items sold. But does it? We've observed instances where some of our clients sold significantly more items than what Amazon displays on their product detail page. This raised the question: why the disparity? That's why felt the need to conduct a study to gain insights on this new Amazon Indicator. Our objective is twofold. To comprehend its significance ourselves and to assist you in understanding its impact on your Amazon business. As a company dedicated to harmonizing 1P operations on Amazon with the platform's system, it's imperative for us to scrutinize even the slightest changes in Amazon's core functions.
What is the Bought Past Month Indicator?
The BPM is not the Indicator for your heart beats per minute.
However, in the world of Amazon the BPM Indicator is almost as vital.
What.
It describes a variable for items that are bought in the past month and is shown on the product detail page on Amazon. However, the Indicator can change in a heart beat having crucial impact on your Amazon nervous system. Therefore it is possibly moderated by variables like abonnements, bundle items or the stationary of your FBA.
How.
The BPM Indicator was introduced to the German Amazon market in November of 2023. Since then we experienced an subtle impact on our customer sales performance. Resulting into the believe that the Indicator might have a moderating effect on a consumers product perception.
The further we inspected the impact on the revenue of our Amazon vendors the question remained:
What is the Indicator actually implying?
Why.
In our experience a possible variable could be the component of social proof.
Meaning a product that showcases poor scores of sold items within a month might appear less desireable to a potential consumer. Especially compared to a product that showcases a higher score on the BPM Indicator.
Cracking the Bought Past Month Indicator
Our sample for analyzing sales trends consists of approximately 8% of all ASINs from our dataset, encompassing 170 different clients. Approximately 10% of all items we reviewed display the Amazon Indicator. However we only considered active products that are in the BuyBox. The most common occurrence were products with 50 or more variations. In addition the majority of values were found in the Toys category, comprising 18.9% of all ASINs, while the Books category showed minimal indication (Fig. 1).

Figure 1 showing a scale which represents the percentage of ASINs with a BPM Indicator within a category
Learnings & Insights from our Study
Given the short period of time the Indicator is part of Amazons interface we can only make assumptions based on our well extended knowledge and experience of 20 years into the business.
In our research and evaluation of the BPM Indicator we discovered that there is a significant difference in what the Indicator displays and how many pieces were actually sold within a period of 30-31 days.
We calculated a differential threshold that forms under the following equation: Difference = shipped items – BPM Indicator.
It defines the magnitude of the shown Indicator deriving from the actual items sold.
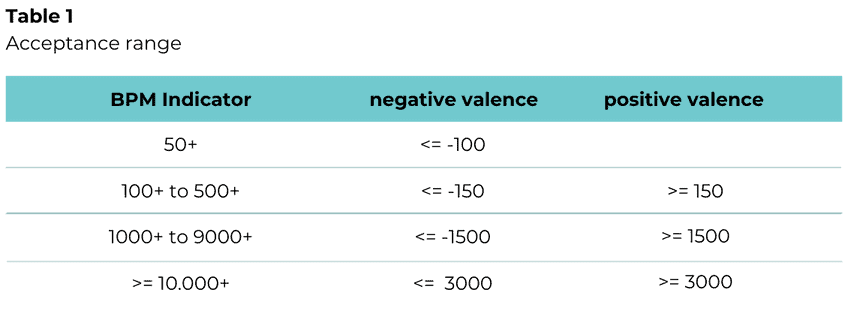
In the table below you can see how we selected the items and categories effected by the indicator.
An Alternative Assumption about what the BPM displays
We were able to show, that the Indicator is crooked and not displaying the amount of items bought in the past month. Hence we thought about alternative possibilities of what this Indicator is reflecting.
One possibility is that the indicator is showcasing the number of customers who purchased an item last month. If so, we should observe customers buying multiple units for all negative variations.
To investigate this hypothesis, we’ve analyzed the top 100 items with the largest deviation from units sold. Most examples turn out to be heavily driven by subscription-based items, often with a minimum order quantity.


Conclusion
What does that mean for you as an Amazon vendor (1p)?
Amazon provides this metric to give customers a more complete picture of which products are currently popular. Hence allowing them to make an more informed purchase decision.
Our present findings reflect a subtle impression on what this Indicator displays and how it might impact your sales and overall performance on Amazon.
We came to the temporary conclusion that this Indicator is influenced by a couple potential factors.
- Abonnements
- Seasonal Products
- Location of the FBA
to conclude it can pertain to the immediate impact on your Amazon vendor success and performance, as well as the long-term impact on your Amazon operations.
Thus it is absolutely inevitable to further track this Indicator to get a better understanding of how it is impacting your sales performance and your success as an Amazon vendor.


Share This Story, Choose Your Platform!
Related Posts


Details that matter!
Details that matter!
Receive our exclusive insights, articles, and announcements in your inbox.

